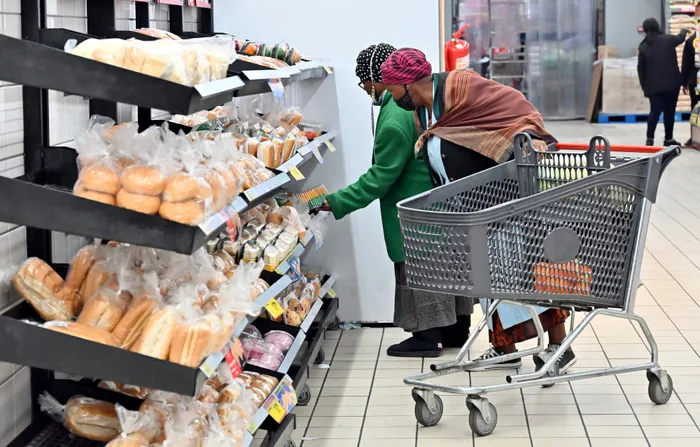
Although the official inflation rate is 2.8%, many South Africans feel prices are rising faster than that. To help people understand their personal cost increases, Statistics South Africa offers a DIY guide on its website for calculating individual inflation based on personal spending
Image: Ayanda Ndamane/ Independent Newspapers.
With the official inflation rate at 2.8%, consumers may be asking themselves how this is possible because their experience at the till point belies the number recently put out by Statistics South Africa.
The official statistics agency has, however, made it easy for people to calculate their own inflation basket. On its website, it provides a do-it-yourself guide to working out how much items are going up each month for the ordinary South African.
Last Wednesday, Statistics South Africa issued the latest Consumer Price Index (CPI) print, which went up from 2.7% in March to 2.8% in April. This increase in the cost of living was a bit higher than Old Mutual chief economist Johann Els had expected (2.6% to 2.5%), although it was lower than what Investec chief economist Annabel Bishop had anticipated (closer to 3%).
The data indicated that the higher rate was driven by housing and utilities, food and non-alcoholic beverages, alcoholic beverages and tobacco, as well as restaurants and accommodation services.
Focusing on the example of education, Statistics South Africa said that the first step was to look through the 391 products in its Excel dataset to identify those associated with education. Statistics South Africa does not include all items on which consumers spend money in every monthly basket.
In the spreadsheet, it said, there are 20 items relevant to education, which are across different categories in its CPI basket, which was last updated in January. For example, it noted, school uniform items are classified under clothing and footwear, while textbooks and books are listed under recreation, sport and culture. Consumers may also want to add aspects such as sporting equipment.
Building a separate spreadsheet for all these items is advised.
The second step Statistics South Africa details is identifying the weights associated with the product, which are also in the spreadsheet. This determines each item’s contribution to increases in total household spending.
For example, school jerseys account for 0.07%. Adding together the 20 items Statistics South Africa identified for its example, the weight of education in terms of this category’s contribution to increases in cost of living, it gets to 3.61%.
The agency then demonstrated the calculations (third step) that are required to work out each product’s contribution to its custom basket, which requires adjusting weights.
This is done by dividing the basket weight for each product as listed in the spreadsheet by the total of 3.61%. For example, the calculation for school jerseys is: 0.07/3.61 = 0.020, which provides the weight of school jerseys in terms of the custom basket for education.
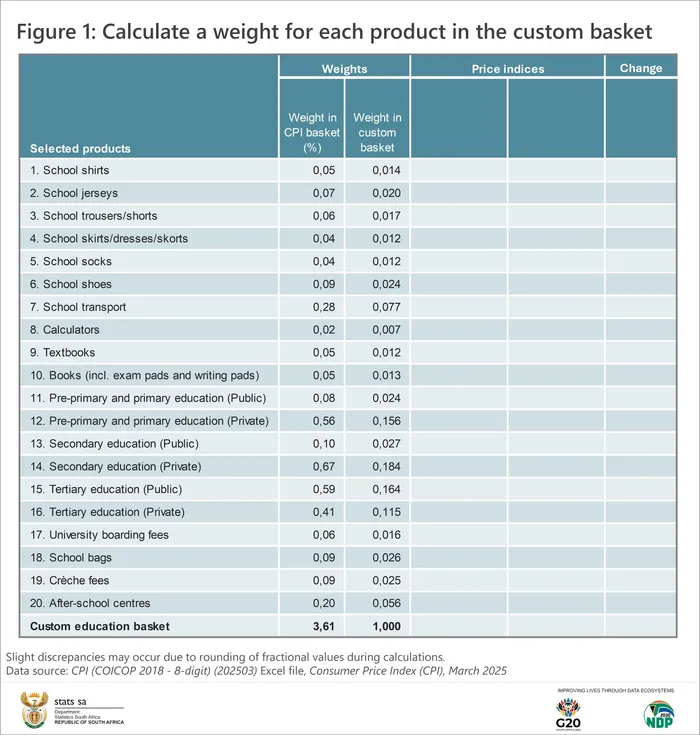
Calculate a weight for each product in the custom basket
Image: Stats SA
Step four involves requires sourcing price indices for two time periods from the spreadsheet that will, eventually, provide the inflation rate for our custom basket. In this example, indices for February 2025 and March 2025 are selected, which will show the month-on-month increase for the basket when all the calculations are complete.
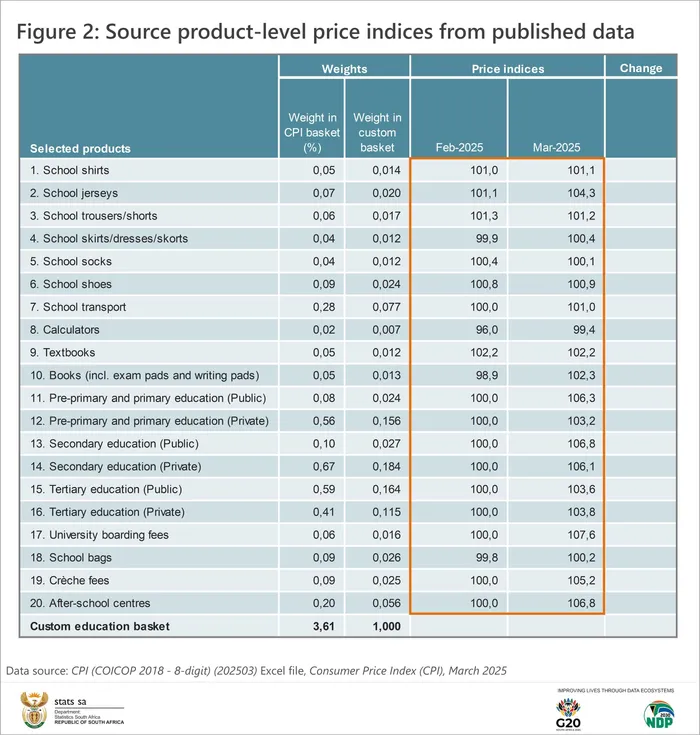
Source product-level price indices from published data
Image: Stats SA
Step five is to calculate two price indices (one for February and one for March) for the custom basket as a whole. “This is the trickiest part of the exercise but can be easily done in Excel,” said Statistics South Africa. (Or one could use an alternative software provider’s tools.)
Two calculations are involved. First, determine a weighted index for each product by multiplying the product’s price index by its weight. For example: School jerseys: 101.1 x 0.020 = 2.02
This needs to be done for each product in the list, it explains, which will result in 20 weighted indices for February. The second calculation is to add up all these weighted indices to give us an aggregate index for our basket, which is 100.1 for February. The same method returns an overall index of 103.9 for March.
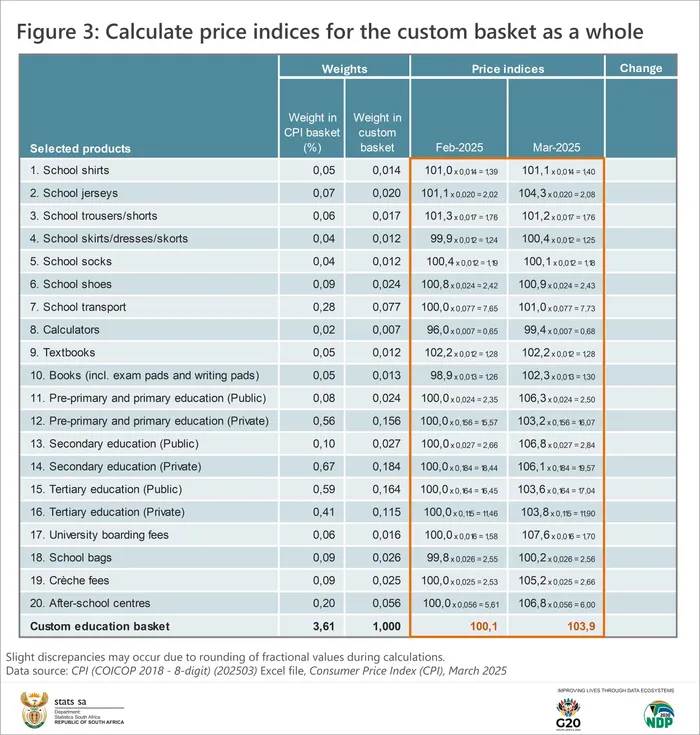
Calculate price indices for the custom basket as a whole
Image: Stats SA
Finally, it noted, the sixth step is to calculate the percentage change in price – which then provides the inflation rate – for the custom basket using these the February and March indices.
Subtract the February index from the March index, divide the difference by the February index and multiply by 100: [(103.9 – 100,1) / 100.1] x 100 = 3.8
This will show that the increase in the overall price of education – based on the products in the customised list – increased by 3.8% between February 2025 and March 2025.
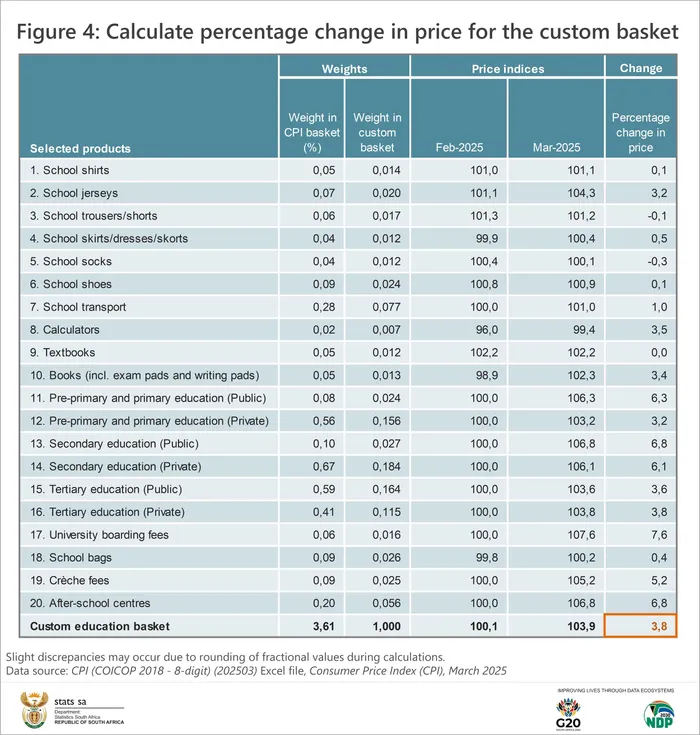
Calculate percentage change in price for the custom basket
Image: Stats SA
The same percentage change formula is used to calculate an inflation rate for each of the 20 products. The price of school socks decreased by 0.3 percentage points between February and March. Fees for public secondary education and after-school centres increased by 6.8 percentage points.
Information on how to create a do-it-yourself basket is available on the Statistics South Africa website.